
In this episode of X10, Nicola further elaborates on overpopulation, describing multiple UN population projections over the next eighty years and describing what might happen in a world with rejuvenation.
Sources and Further Reading
Once more, a lot of the data presented in this episode comes from Our World in Data (OWID), but there’s a lot coming from the UN Population Division and others.
- You can read about the UN population projections on its freely available publication World Population Prospect 2019 Highlights. In general, all the UN data used in our overpopulation episodes can be found on its website here.
- The accuracy of UN projections over the years has been discussed by OWID here.
- Disagreement with the UN projections
- The paper disagreeing that the world population will stabilize by 2100 can be found here.
-
-
- The book arguing that the world population is more likely to decline than stabilize by 2100 is Empty Planet: the shock of global population decline, by Darrel Bricker and John Ibbitson, published by Hachette UK in 2019. In essence, the authors believe that something like the UN low-variant scenario is the most likely outcome, and that while this will bring benefits in terms of ecology, environment, and so on, a shrinking number of young people and an increasing number of elderly people will be a challenge for our consumption-based economy. This is true even in the medium-variant scenario, so even if they were wrong about the low-variant one being more likely, it’s still a good point. A weak point of the book is that the conclusions it draws are heavily based on interviews of different people around the world. They are interesting, but they’re not enough to conclude with any certainty that the population is shrinking faster than the UN projections say. However, some demographers seem to agree with the thesis presented in Empty Planet, as it is stated in the book itself. If you are interested, here’s a review of the book; interviews with the authors can be found here and here.
- You might be interested in reading about China’s population decline. Apparently, even Elon Musk and Jack Ma are more worried about population decline than overpopulation.
-
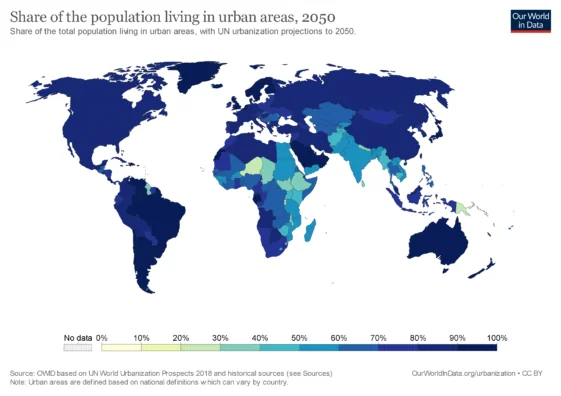
- The data on urbanization in the episode was from OWID and is available here. If you’re interested, you can have a look at its data on the growth of urbanization in recent decades (also as an interactive map) and over the past 500 years.
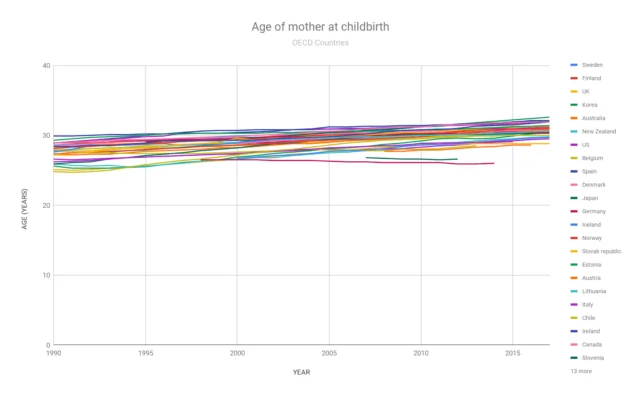
- The data on the mean age of women at childbirth used in the episode comes primarily from the OECD website, which is a bit clunky to use. This paper, published by the same organization, shows that the mean age at which women are having their first child is increasing. Similar trends appear in Norway, the EU in general, New Zealand, and the US.
- About fertility: you can read all about it in the relevant OWID article, including the effects of education and religion mentioned in the episode. Speaking of education, here, you can see how levels of education have been increasing in general and for women in particular. The UN projection for the global fertility rate is available here; there’s a dropdown menu on that page which you can use to visualize the projected fertility rate for different countries. You will see that it’s projected to go down pretty much everywhere, very often going below replacement level (the dashed green line). In some cases, like that of Southern Europe, it’s projected to go up, and yet it will still be below replacement level, because it already is below it!
- How the worst-case scenario approximations were calculated
- In this Google Sheet, you’ll find several tables with data from the UN and data that was extrapolated from it to make the approximations shown in the episode. Please remember that these are not accurate projections of how life extension might impact population growth; they are just approximated worst-case scenarios in which far fewer deaths will happen until 2100 than it is realistic to expect. Assuming that the fertility rate will not change, these approximations provide a very tall ceiling for the population size. If the fertility rate changes, all bets are off.
- The charts sheet shows a comparative chart of the three UN projections, a comparative chart of the reconstructed medium-variant scenario, the NO-ARDs (i.e., no age-related deaths) scenario, and the NO-DEATHS scenario, and a comparative chart of the growth rates for the three scenarios just mentioned. See further below to learn about the reconstructed medium-variant scenario.
-
-
- The UN birth data sheet contains the number of births the UN expects in the medium-variant scenario between 2020 and 2100 in groups of five years. (Eg, the total births expected between 2020 and 2025, between 2025 and 2030, and so on.)
- The UN mortality data sheet contains the number of deaths the UN expects in the medium-variant scenario between 2020 and 2100 by age brackets and in groups of five years.
- The extrapolated birth data sheet contains the number of births expected for each year between 2020 and 2100. This data was extrapolated from the UN birth data sheet, simply by dividing the total births of each five-year group by 5. For example, the total births expected between 2020 and 2025 is 697,667,775, so, on average, we can expect each year between 2020 and 2025 to have 139,533,555 births (697,667,775 divided by 5). This likely introduces small approximation errors in the calculations.
- The extrapolated mortality data sheet contains the number of deaths expected for each year between 2020 and 2100. This data was extrapolated from the UN mortality sheet using the exact same method used for the extrapolated birth data sheet.
- The extrapolated mortality data without ARDs sheet is just like the extrapolated mortality data sheet, except it doesn’t factor in any deaths happening at age 65 or above.
-
- The UN projections sheet contains a table with the expected population numbers for each year from 2020 to 2100 according to all three UN projection variants: low, medium, and high. The low and high variants are included only for reference and are not used in any calculation. The table also contains a reconstructed version of the medium-variant projection. The reconstructed version recalculates the population for each year between 2020 and 2100, using the official 2020 population figure and the extrapolated birth and mortality data as starting points. For example,Pop in 2021 = Pop in 2020 + extrapolated births 2021 – extrapolated deaths 2021and so on. As expected, the extrapolated data produced small approximation errors that resulted in a slight difference from the original medium-variant projection. This difference is reported in the sheet, and on average it’s -0.02%.
-
- The NO-ARDs and NO-DEATHS past 2020 sheet shows what the reconstructed version of the medium-variant scenario is like without age-related deaths (NO-ARDs MEDIUM column) and without any deaths at all (NO-DEATHS MEDIUM column). Both scenarios are basically the same as the reconstructed version of the medium-variant projection. The NO-ARDs MEDIUM version uses the extrapolated mortality data without ARDs sheet (and thus doesn’t subtract any death at age 65 or older), while the NO-DEATHS MEDIUM doesn’t subtract any death at all.
- The growth rates sheet shows the official UN annual growth rates for the medium-variant scenario as well as those of all the reconstructions. Keep in mind that the UN data provides the growth rate as a 5-year average; for example, the growth rate is the same every year between 2021 and 2025.
- The number of births and deaths chart is from OWID, available here.
- The data on the causes of death globally by age is again from OWID, see here.
Script
In our previous overpopulation episode, we talked broadly about overpopulation and its potential consequences on our planet and society. We also had a look at how the human population grew throughout the centuries—from the super-slow growth of our very early days to the explosive growth of the last seventy years or so.
At the end of that episode, we were left with an important question: if therapies existed to slow down or even reverse aging and our lifespans got much longer as a result, would this lead to overpopulation? It’s time to look into population dynamics.
Welcome to X10, your one-stop YouTube show for all things life extension. While we’re at it, if this is your first time here, consider subscribing to our channel! Don’t forget to click the little bell icon and select “all notifications” to be notified whenever a new X10 video is out.
![]()
Before we can try to estimate the demographic effects of life extension therapies, we need a starting point: how much is the human population projected to grow over the next several decades without life extension?
The latest projections from the United Nations feature three main scenarios: high, medium, and low. The medium-variant scenario describes what is most likely to happen according to UN researchers, and it looks like this:
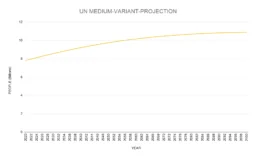
The human population will continue to grow more and more slowly as the turn of the century approaches; according to the UN, there’s about a 27% chance that the population will stabilize or even begin to decline around the year 2100, barely short of 11 billion people. In this scenario, the growth rate of the world will look something like this:
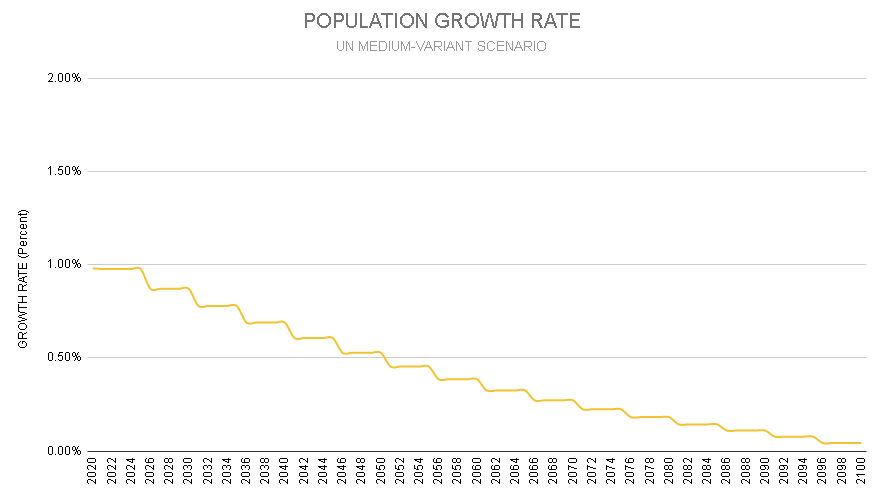

The annual average growth rate will keep plummeting, as it has been doing since the 1960s. This rate is calculated as a percentage of the existing population: if the growth rate of this year was 2%, it means that this year the population was 2% larger than it was last year.
The growth rate depends on two things: how many people are born each year and how many die. So, all other things being equal, the more babies a woman has on average in her life, the faster the growth. The average number of babies per woman is called the fertility rate.
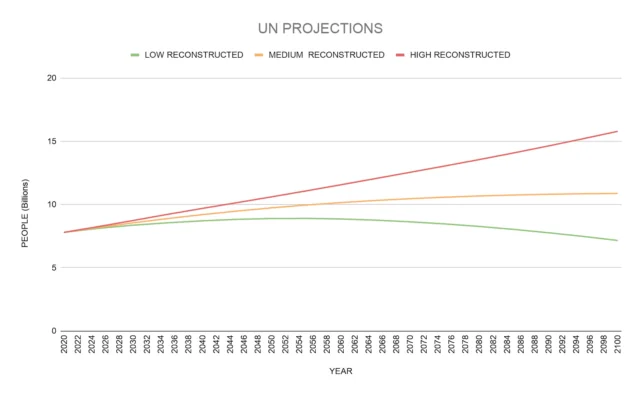
The difference between the medium-variant scenario and the other two scenarios lies in the fertility rate: the high-variant scenario assumes that, by the end of this century, the fertility rate will be 0.5 babies more than in the medium-variant scenario in each country; the low-variant scenario assumes it will be 0.5 babies fewer. If you look at the projection, it’s impressive how much of a difference half a baby can make.
In the high-variant scenario, by 2100, we are supposed to hit almost 16 billion—that’s about five billion more than what the medium-variant scenario predicts.
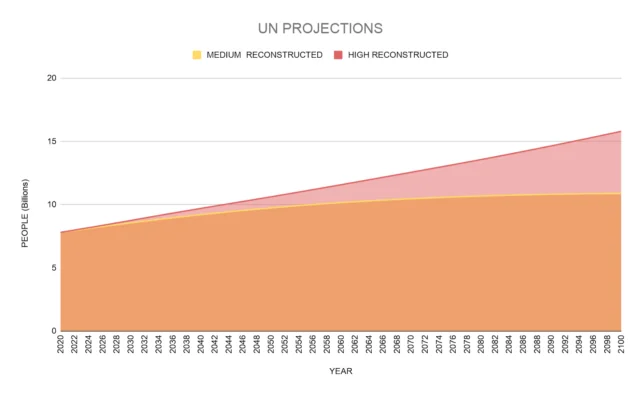
In the low-variant scenario, population growth will slow down much more dramatically than in the medium-variant one: our population will hit a peak of about 8.5 billion people in the mid 2050s and then slowly decline to just above 7 billion in 2100.

Thus far, the UN projections have been extremely accurate, although not everyone agrees with the presented scenarios. For example, a paper published in Science in 2014 analyzed the data that the UN published in 2012 and argued that the world’s population is unlikely to stabilize by 2100 and will probably keep growing instead.
Disagreement doesn’t go only one way: some believe that the UN is overestimating population growth, and that if anything, rather than an overpopulation problem, we might have a depopulation problem later in this century. This is what Darrel Bricker and John Ibbitson argue in their book Empty Planet, in which they essentially make the case that what’s more likely to happen is closer to the UN’s low-variant scenario and that it may be coming faster than the UN thinks.
In the authors’ opinion, the UN may be underestimating the speed of urbanization around the world: more and more people move away from rural areas to the cities, which has important consequences in terms of fertility rate.
The most obvious one is that, while in rural areas, another child is another pair of hands that can do work to support the family, in the city, another child is another mouth to feed. In rural areas, couples have an economic incentive to have more babies, while in the city, they have an incentive to have fewer.
Also, as more and more women have access to better education, they learn to expect more from life than just being mothers: they tend to want and have fewer children, and they have them later in life; this is something that we’ll return to in the next episode.
The pressure to have lots of babies quickly, which was put on women for most of human history, also declines as people become less religious and clans lose their importance: women are no longer surrounded by huge families asking for more babies but by much smaller families and by friends and coworkers who exert a lot less baby pressure, if any.
The authors of Empty Planet claim that all of this is pulling the fertility rate down, in some cases to or below the replacement level of 2.1 babies per woman. It’s definitely true that the fertility rate is going down, both globally and locally in areas where it is traditionally high, and it’s projected to keep at it according to the UN itself; whether it will actually do so faster than the UN thinks, as they suggest in Empty Planet, is a different story.
However, none of the projections and predictions we’ve seen so far have taken life extension into account; they all assume that old age will, more or less, keep taking its usual toll for the foreseeable future. How would these projections change if we assumed that we could slow down or reverse aging as of right now?
Making an accurate, realistic projection of the effects of life extension on the global population is not an easy task. There are a lot of variables to take into account: will the therapies just slow down aging or will they reverse it? How effective will they be? How widespread? When will they become available? How quickly will they spread? How long will it take to develop more effective therapies?
The answers to these questions will determine how many more people will die of age-related causes in the future, and we don’t know them yet. They’re not the only important questions, either.
For example, even if we assume that therapies will be so effective that nobody will die of old age anymore, chronologically old people might still die of other causes of which they’re less likely to die of today. In 2017, vastly more people aged 70 and older died of cardiovascular diseases than road accidents; for people between 15 and 49 years of age, road accidents were the fourth leading cause of death worldwide.
If age-related diseases were eliminated entirely, these numbers would change, probably dramatically, and it’s hard to predict how. Consequently, it’s hard to tell exactly how much longer rejuvenated people would live and contribute to the size of the population.
Another crucial question is whether life extension therapies will affect the global fertility rate. Therapies that only slowed down the progression of aging wouldn’t necessarily make older people able to have children again, which means that they would not be able to push the fertility rate higher. If, instead, we imagine incredibly effective rejuvenation therapies that preserve our ability to have children at any age, the result is hard to predict.
In this case, chronologically old people would be able to have all the children they want, but would they want to? In particular, the first rejuvenated elderly people are likely to already have had children by that point, and they might have other plans for their future as newly young people than rushing into parenthood all over again. Still, at least some rejuvenated elderly people might very well have more children.
What about chronologically young people who never had children before? At the moment, if they want to have children, they have a time constraint, and this is especially true of women, for whom conceiving and giving birth becomes more difficult and dangerous as years go by. If we had rejuvenation therapies that made people able to have children safely at any age, the time constraint would be gone, and entire armies of mothers, aunts, and grandmothers would lose their best excuse to pester the younger women of their families about how they should rush to have kids before it’s too late.
As a matter of fact, for whatever reason, women are already postponing their first pregnancy. For example, in countries belonging to the Organisation for Economic Co-operation and Development, or OECD, the average age at which women had children in 1990 was well below 30; in 2017, it was closer to 31. The age at which they have been having their firstborns is rising as well.
If this is happening now, in spite of biological time limits, it’s not unreasonable to expect that if the limit were removed, women might postpone pregnancy even more and not just because they prefer to prioritize their career or other things, but also because as a rule of thumb, the older they are, the more life experience they will have accrued, possibly making them better parents.
So, making an accurate demographic projection on the effects of life extension on the global population is beyond what we can do right now, on this show anyway, but we can still get a sense of how bad the situation might get by imagining two completely unrealistic worst-case scenarios.
Since we can’t make a sensible prediction of how life extension might change the number of births, let’s assume that it will stay exactly the same as in the UN medium-variant projection in both our worst-case scenarios.
In the first scenario, we also assume that all deaths of people aged 65 and above are exclusively age-related, and that starting in 2021, none of them will happen. This means a lot fewer people dying and a lot more people to add into the total population count, which will likely be a huge overestimate by a long shot for three reasons:
- There’s no chance that we will have fully effective rejuvenation therapies in 2021 already, let alone uniformly distributed all over the world. Different generations of different therapies will gradually be developed over the course of decades, if ever, leading to a gradual decrease in the number of age-related deaths rather than a sudden drop;
- Rejuvenated elderly could still die of something else, while we’re assuming that nobody aged 65 or older ever dies;
- Even though aging makes death from virtually all causes more likely, assuming that all deaths past age 65 are strictly age-related is likely an exaggeration.
So, the population numbers we’re going to get are very likely to be a gross overestimate, meaning that the actual numbers would be a lot lower. The overestimate looks like this:
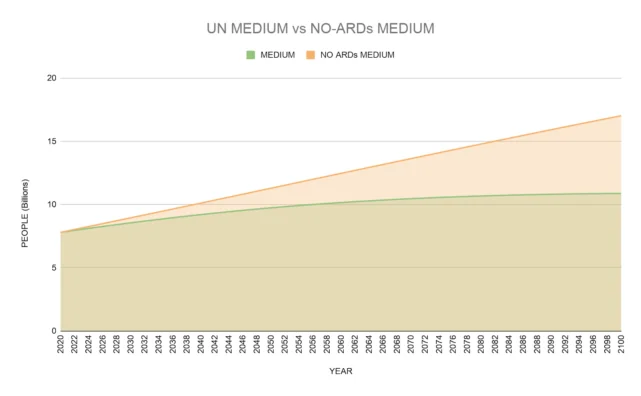
In this scenario, we would hit 11.2 billion in 2050 and 17 billion in 2100. That’s a lot, even more than the UN high-variant scenario, but probably a lot less than you were expecting—and remember that it’s a gross overestimate.
The second gross overestimate is like the first, except we’re going to assume that, starting 2021, no one at all, of any age, will die. It should be clear enough why this is definitely an overestimate. The chart looks like this:
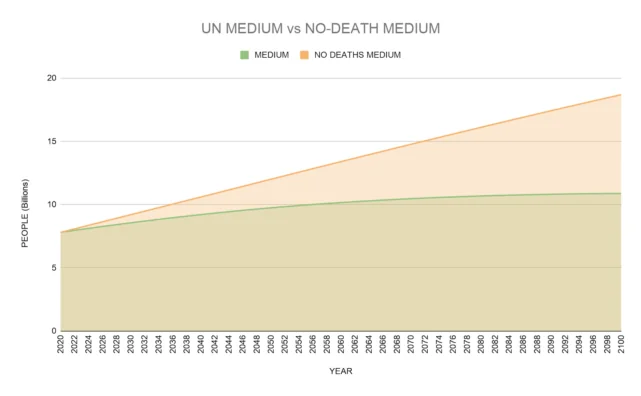
In 2050, we would hit nearly 12 billion, and in 2100, we’d be at about 18.7. This is still worse than the UN’s high-variant scenario and, of course, worse than our previous scenario, but not by much, considering that, again, we’re assuming no one ever dies.
Of course, both of these scenarios have an important limitation: they assume that the number of births will be exactly the same as what the UN expects in its medium-variant scenario, and, again, we can’t be sure of that if life extension is factored in. It will surely change, but it’s hard to tell if it will go up or down and by how much.
This is one of the reasons why these two scenarios are just rough worst-case approximations and definitely not accurate projections, but they do illustrate an important point: while longevity does of course play a role in how fast the population grows, the true driver of growth is the fertility rate, and, consequently, the number of people born in a year.
In both scenarios, we dramatically reduced deaths or eliminated them entirely, and yet the growth wasn’t so spectacular. The reason is that, in both scenarios, the number of annual births kept going down essentially the entire time, as a consequence of a declining fertility rate.
To see what’s going on, we need to go back to something we mentioned before, the replacement rate. The replacement rate is the fertility rate necessary to keep the population stable. If the fertility rate is below the replacement rate, the population will shrink; if it’s above it, the population will grow. If the fertility rate is exactly equal to the replacement rate, the size of the population won’t change.
In an ideal world, the replacement rate would be exactly two babies per woman, just enough to replace her and her partner when they die.
However, we need to take into account that not every child born lives into adulthood, and not every adult woman ends up having babies, so, with a replacement rate of exactly 2, not every individual is actually replaced. To account for this difference, an adjusted replacement rate of 2.1 has been calculated based on current mortality and birth trends. On a global level, when the fertility rate is 2.1, the net effect is the same as a fertility rate of 2 would have in an ideal world: zero population growth.
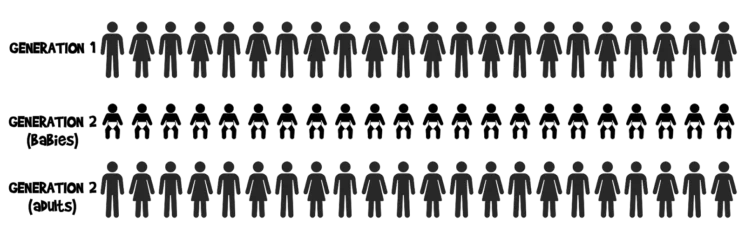
If the fertility rate is above 2.1, the next generation will have more people than the preceding one. If the fertility rate stays above 2.1 over time, each will be larger to the preceding one, leading to a larger and larger population. The larger the fertility rate is, the faster the population will grow.
However, unless the fertility rate is exactly at replacement level or below, halting population growth is not possible. That’s because when a certain generation dies off entirely, it leaves behind a larger one. At the moment, the global fertility rate is barely below 2.5, so our population is growing, but the growth is projected to slow down and possibly come to a halt around 2100, when the fertility rate is expected to be just below replacement.
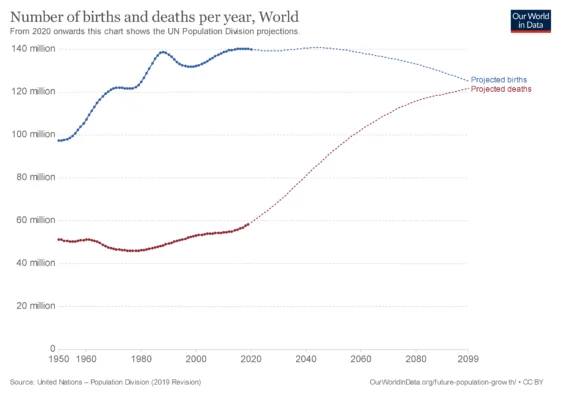
At the moment, about 140 million people are born each year, while around 60 million die. Over the course of the next century, the number of annual births is projected to stay pretty much constant for about 50 years, and only then it will start declining; deaths are projected to increase all the time, primarily as an effect of population aging.
This is what is supposed to stabilize our population, but it will only work if births don’t go up. If they do, the population will grow. That’s precisely what happens in the UN’s high-variant scenario, where the fertility rate goes up by just half a baby while deaths stay mostly the same as they are in the medium-variant scenario.
The bottom line is that the best way to prevent our population from becoming too large is to have fewer babies, regardless of life extension. If the global fertility rate were to stay at the current level, no amount of age-related deaths could prevent our population from eventually spiraling out of control, because far more people would be born each year than would die of aging.
How easy would it be for humanity to have fewer babies? And is this the only way we have to prevent overpopulation? Not really. We’ll talk more about these and other questions in the next overpopulation episode of X10.
Thank you very much for watching this episode of X10! There’s no such thing as YouTube channel overpopulation, so if you like our videos, please subscribe! Also, don’t forget to click the bell icon and then select “all notifications” to be notified whenever we publish a new episode.
Commenting, linking, and sharing with your friends is very much appreciated too, and if you’re feeling extra generous, you could consider becoming a Lifespan Hero. Thanks to their monthly donations, the Lifespan Heroes support both X10 and all the other projects of Lifespan.io, the platform crowdsourcing the cure for aging. Visit lifespan.io/hero for more information.
Thanks again for sticking with us, and see you next time!